microRNAs play a key role in RNA interference, the sequence-driven targeting of mRNAs that regulates their translation to proteins, through translation inhibition or the degradation of the mRNA. Around ~30% of animal genes may be tuned by microRNAs. The prediction of miRNA/mRNA interactions is hindered by the short length of the interaction (seed) region (~7-8nt). We collate several large datasets overviewing validated interactions and propose feamiR, a novel pipeline comprising optimised classification approaches (Decision Trees/Random Forests and an efficient feature selection based on embryonic Genetic Algorithms used in conjunction with Support Vector Machines) aimed at identifying discriminative nucleotide features, on the seed, compensatory and flanking regions, that increase the prediction accuracy for interactions.
Common and specific combinations of features illustrate differences between reference organisms, validation techniques or tissue/cell localisation. feamiR revealed new key positions that drive the miRNA/mRNA interactions, leading to novel questions on the mode-of-action of miRNAs.
Manuscript preprint: https://www.biorxiv.org/content/10.1101/2020.12.23.424130v1
Github: https://github.com/Core-Bioinformatics/feamiR
Documentation: https://core-bioinformatics.github.io/feamiR/reference/index.html
CRAN: https://CRAN.R-project.org/package=feamiR
feamiR was presented at the EMBL Symposium on the Non-Coding Genome in October 2021 (poster and video).
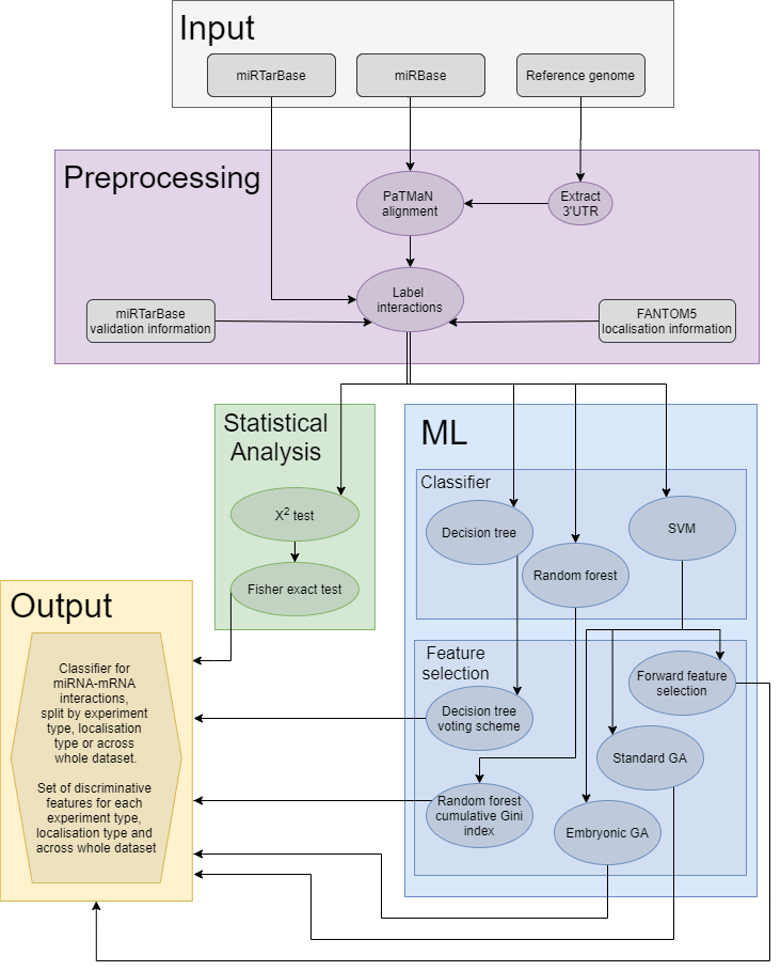
Overview of the feamiR workflow.
feamiR R package
Preprocessing
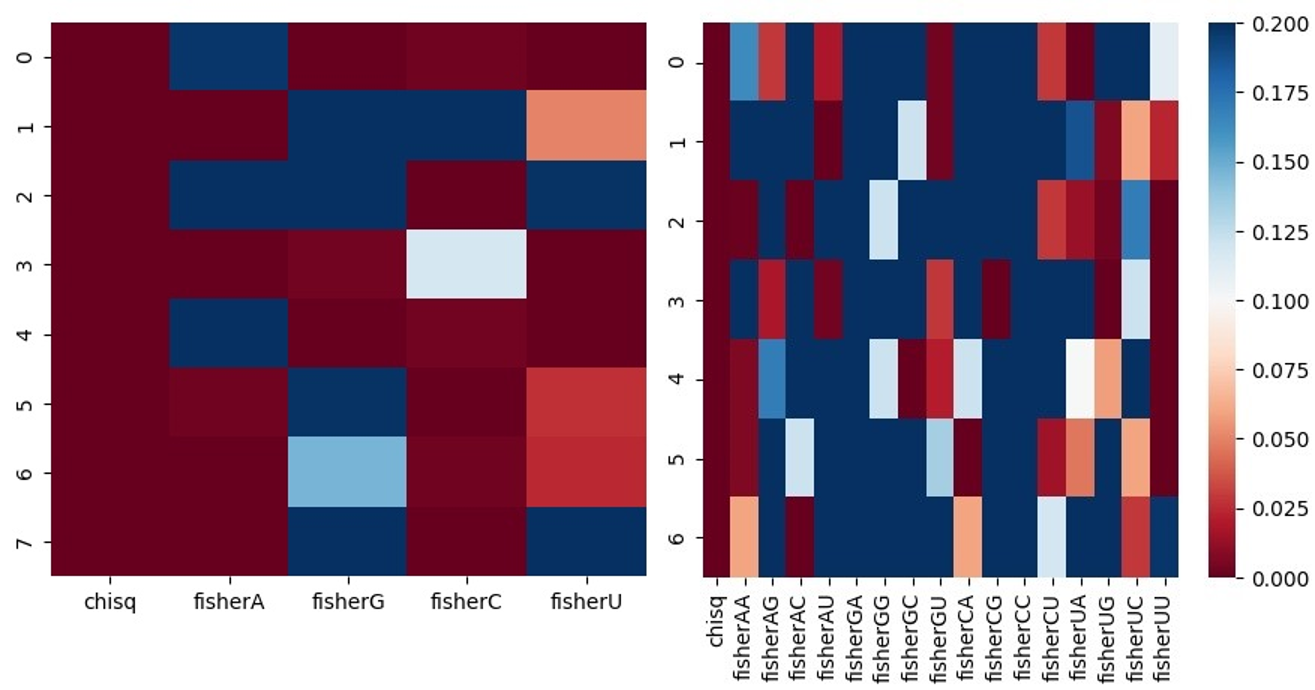
The dataset used for classification and feature selection is generated using the preparedataset function. This function also performs statistical analysis using chi-squared and Fisher exact tests from which heatmaps can be created.
Heatmaps illustrating chi-squared and Fisher exact p-values when assessing differences in positional proportions of single nucleotides (left) and dinucleotides (right) for each position in the positive and negative datasets, using a subset of D. melanogaster miRNAs and mRNAs.
Based on the subsamples created using the preparedataset function, using feamiR several miRNA/mRNA classifiers can be tested. In addition, functions for selecting discriminative features are also available.
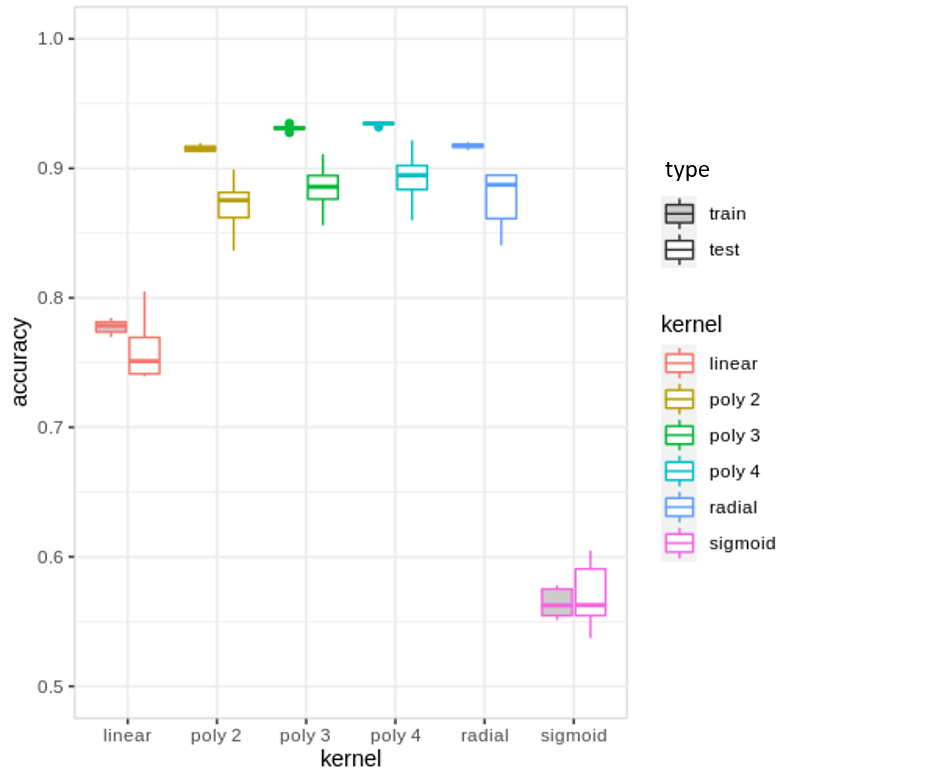
Classifiers
Feature selection
The feamiR package implements 6 feature selection approaches:
- dtreevoting: Uses trained Decision Trees (DTs) for feature selection, by maintaining a record of frequent features and the level of their first occurrence. Selection focuses only on features which appear in the top num_levels levels (from the root, default 10), as these are expected to have higher discriminative power. The selection of features is performed over num_runs runs (user-defined parameter with a default value of 100) on different subsamples output by preparedataset. The first column of the output table contains the number of runs for which each feature was used. The output table can then be ordered by frequency and highest-performing features selected.
Boxplot showing distribution, on DTs, over 100 subsamples of the full H. sapiens dataset, of depth from the root for each feature (considering only features appearing in the top 10 levels). The number of trees where each feature was used is shown above.
- rfgini: Using Random Forest (RF) models, we assess variable importance with entropy-based measures. The importance of predictor variables is measured using ‘mean decrease in node impurity’, based on the Gini index. The function calculates the cumulative mean decrease in the Gini index across num_runs (default: 100) samples output by preparedataset. The first column of the output table contains the cumulative Gini index for each feature across all runs.
Boxplot showing distribution of mean decrease in Gini index of features across 100 runs on different subsamples of the full H. sapiens dataset, ordered by cumulative mean decrease in Gini.
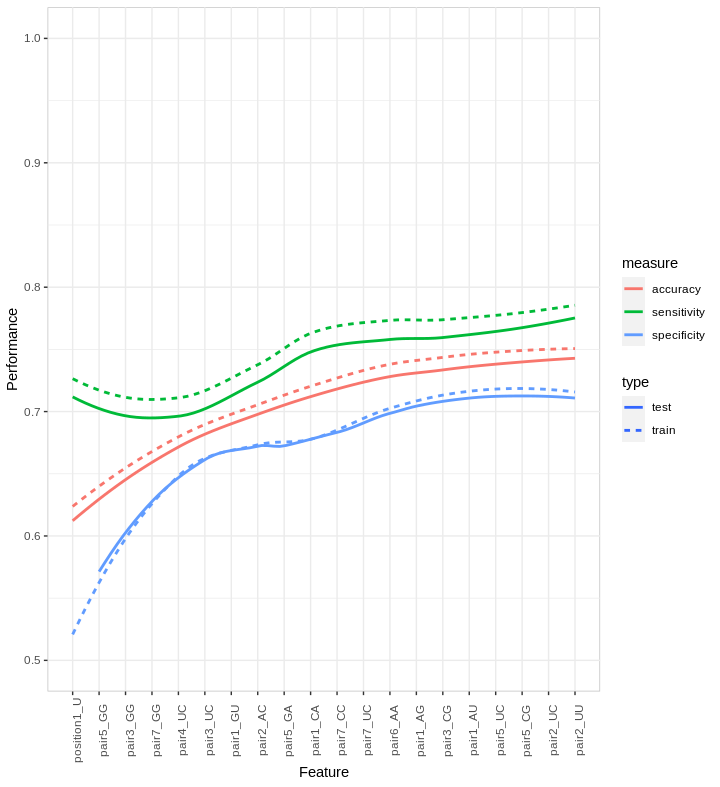
- forwardfeatureselection: Forward Feature Selection uses a greedy approach to select the most discriminative k features. Features are ordered by discriminative power by selecting the feature which increases test accuracy at each iteration. The accuracy with respect to the selection order of features is plotted and smoothed using LOESS. When the curve describing the distribution of accuracies plateaus i.e. adding extra features does not improve the accuracy significantly, the selection process stops. The accuracy is assessed using a specified model, e.g. linear SVM. The function outputs an ordered list of features, along with accuracy, sensitivity and specificity achieved using these features.
Improvement in performance when adding features, ordered on the x-axis, selected by FFS on a subset of the full H. sapiens dataset. The line type indicates the training (dotted line) and test (continuous line) accuracy, sensitivity and specificity for the first 20 features.
- geneticalgorithm: Implements a standard genetic algorithm using GA package with a fitness function specialised for feature selection.
- eGA: Feature selection based on Embryonic Genetic Algorithms. It performs feature selection by maintaining an ongoing set of 'good' features which are improved run by run. This is achieved by randomly selecting new features to combine with the ‘good’ features and performing forwardfeatureselection. It outputs training and test accuracy, sensitivity and specificity and a list of <=k features.
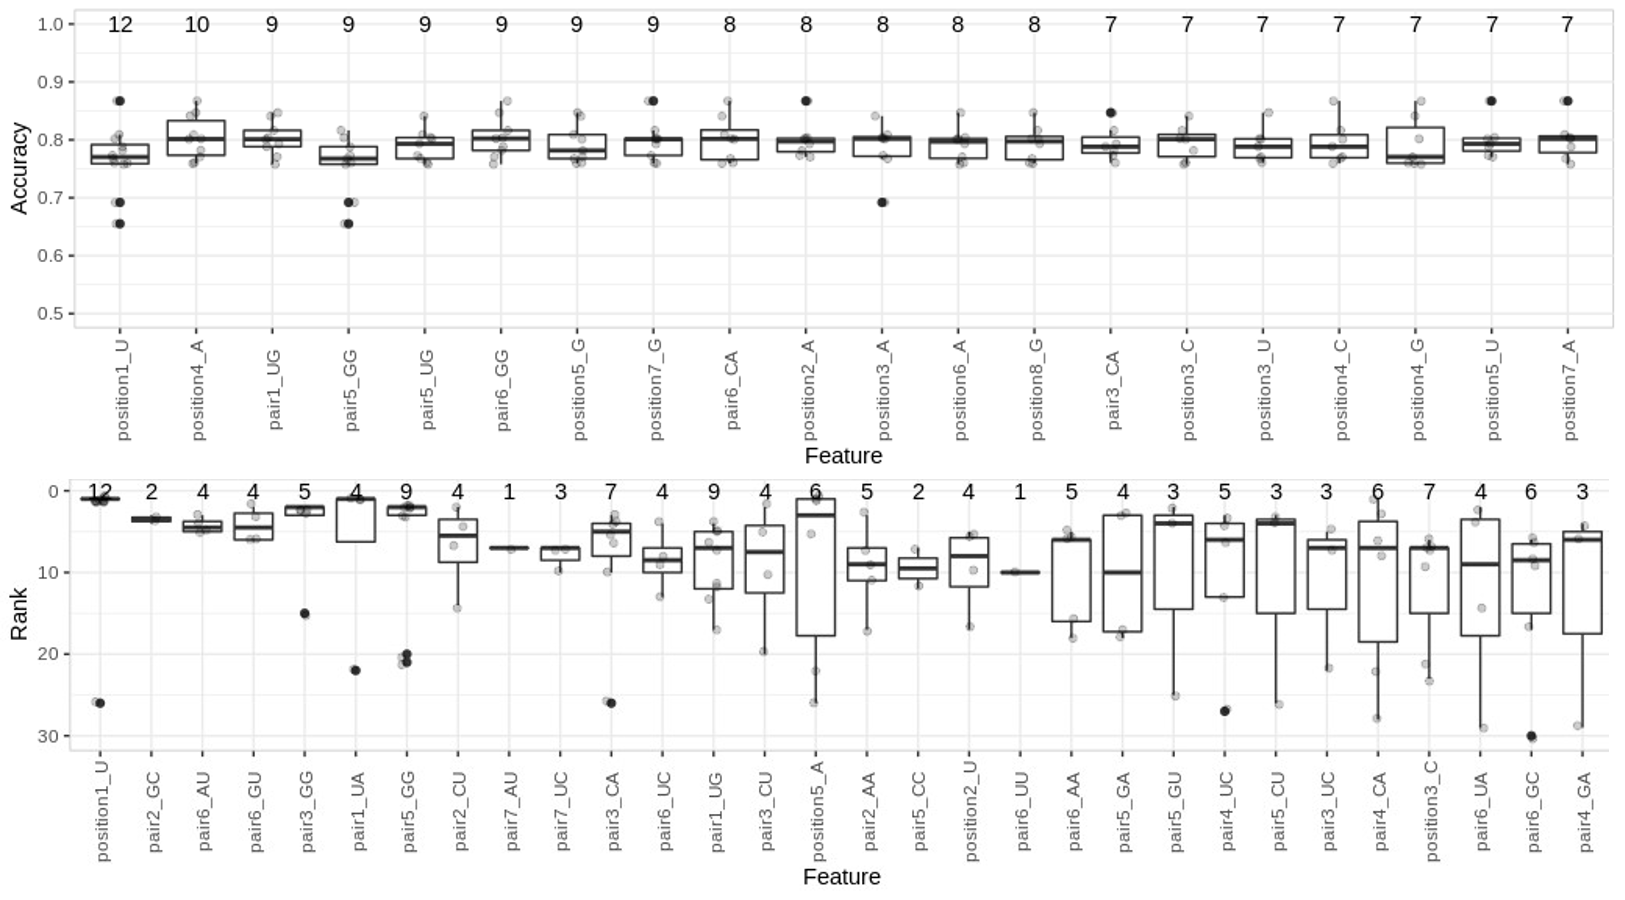
Summary of features selected by eGA on full H. sapiens positive and negative sets. Distribution of ranks (top) and accuracies (bottom) across 100 subsamples for the training data). On top of the boxplots we present the number of selections per feature.
It is recommended to use combinations of these feature selection approaches across multiple subsamples, corroborated with statistical analysis to select discriminative features.
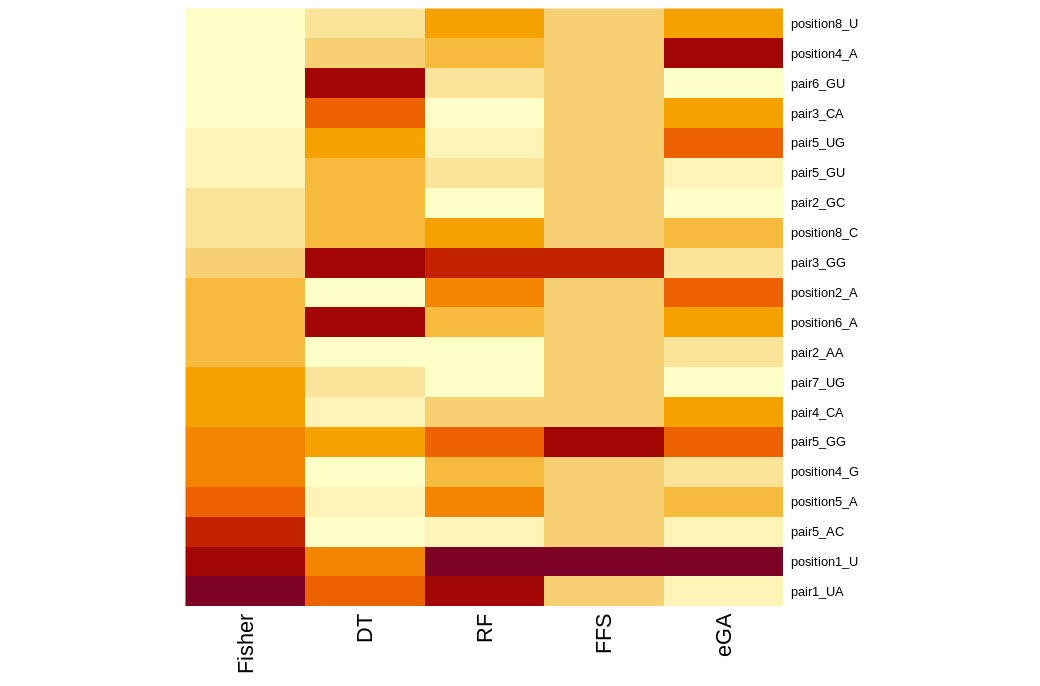
The feature selected using these various methods can be summarized in heatmaps.


