Alt Text:
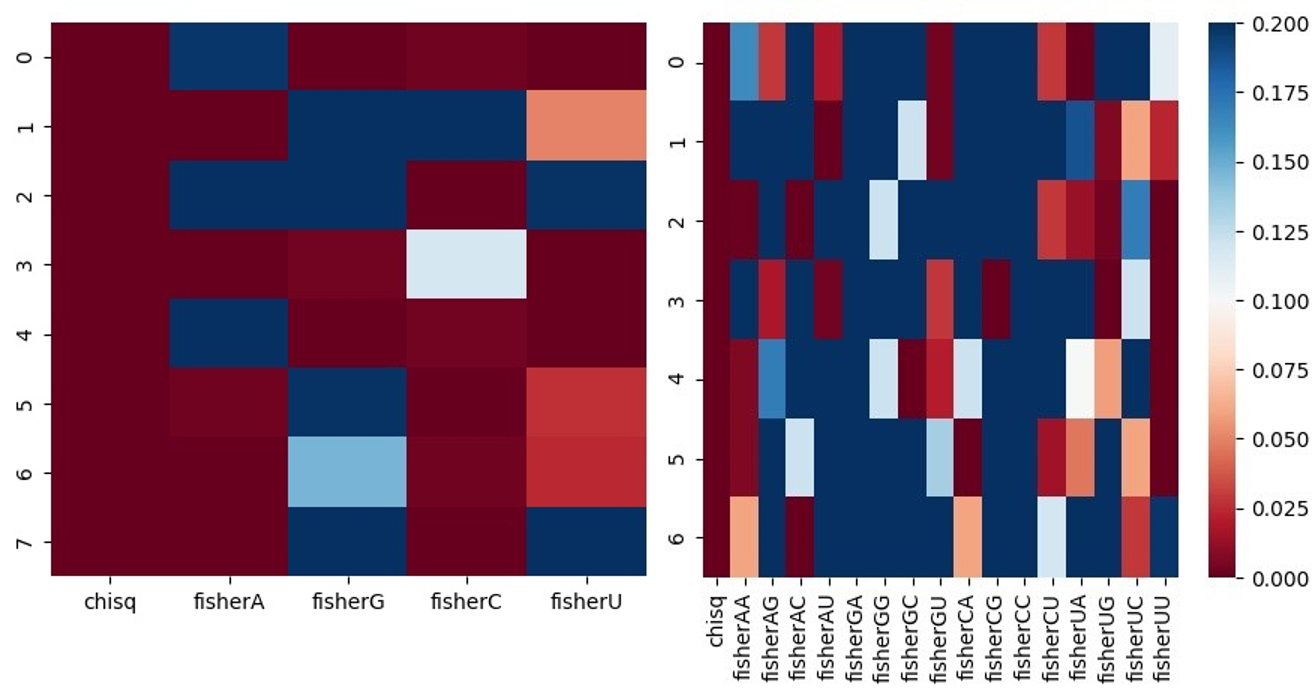
Heatmaps illustrating chi-squared and Fisher exact p-values when assessing differences in positional proportions of single nucleotides (left) and dinucleotides (right) for each position in the positive and negative datasets, using a subset of D. melanogas
Title Text:
Heatmaps illustrating chi-squared and Fisher exact p-values when assessing differences in positional proportions of single nucleotides (left) and dinucleotides (right) for each position in the positive and negative datasets, using a subset of D. melanogas


