
Quality checks are performed on the raw fastq files using FastQC. The alignment to the reference genome can be done using any genome alignment tool, but our standard choice is STAR. Pre- and post- alignment quality checks are then summarised using MultiQC. Gene expression counts can be obtained using featureCounts program. Additional quality checks include density plots, violin plots, MA plots, dendrograms, PCA plots and heatmaps representing the Jaccard Similarity Index (JSI). Using those, samples of poor quality and outliers can be identified and removed before processing.
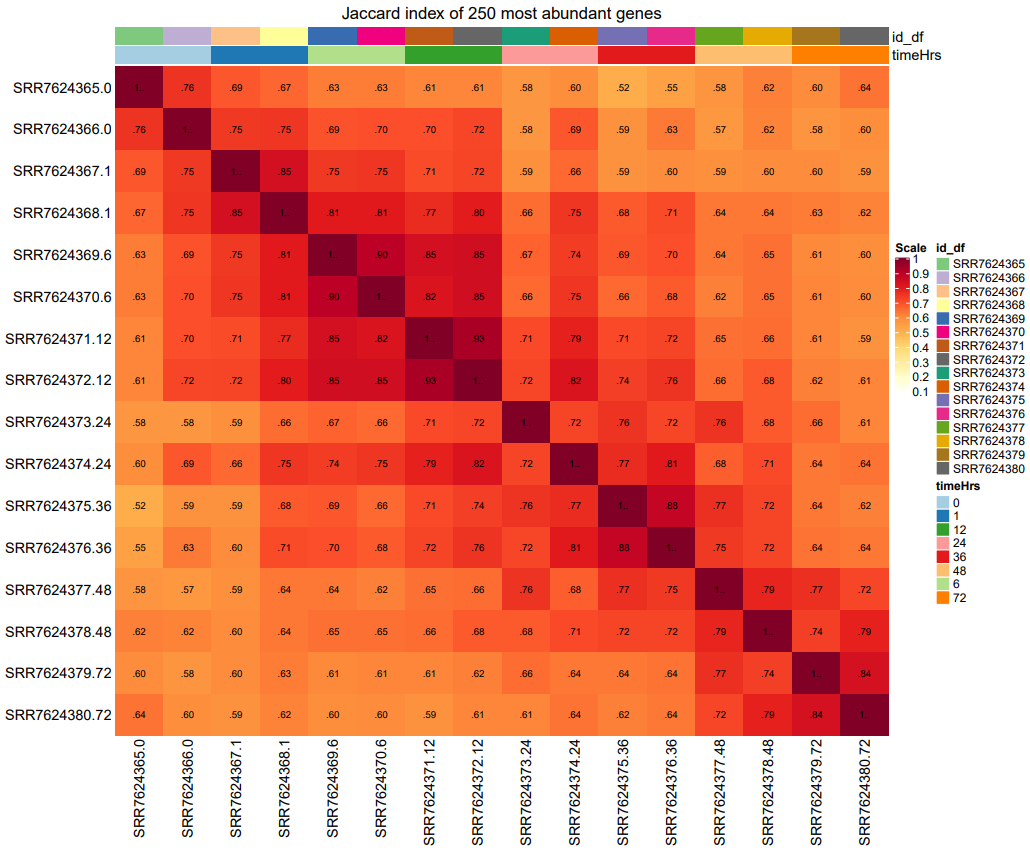
The figure below shows the Jaccard similarity index for a dataset with 8 time points. A value of closer to 1 indicates high similarity.
The noise identification and correction is done using noisyR (Moutsopoulos et al, 2021) and as suggested in Mohorianu et al, 2017. The analysis is performed at sequencing and count matrix level, using the Pearson Correlation as similarity measure, and a threshold of ~0.25 similarity between expression profiles across transcripts (sequencing approach) and windows of abundances (count matrix approach), respectively. For the latter a sliding window of one tenth of the total transcripts is usually used. The validity of the obtained thresholds can be cross-compared with the local minimum determined on the abundance density plots across samples. All transcripts with abundances less than the signal/noise threshold in all samples were excluded from subsequent analyses. The transcripts with at least one entry above the signal/noise threshold were kept for further analyses. For these all entries lower than the signal/noise threshold, were increased to the threshold, to avoid false positive calls on the DE step.
The normalisation of expression levels can be performed in various ways. Our preference is usually quantile normalisation as it is an unbiased, non-parametric approach. The differential expression analysis is performed using the standard functions from either the DEseq or the edgeR pipeline in R (Anders & Huber, 2010 and Robinson et al, 2010). The differentially expressed genes can be summarised in a volcano plot, and cross-plots can be created to compare the expression differences of the same genes in different comparisons, if applicable.
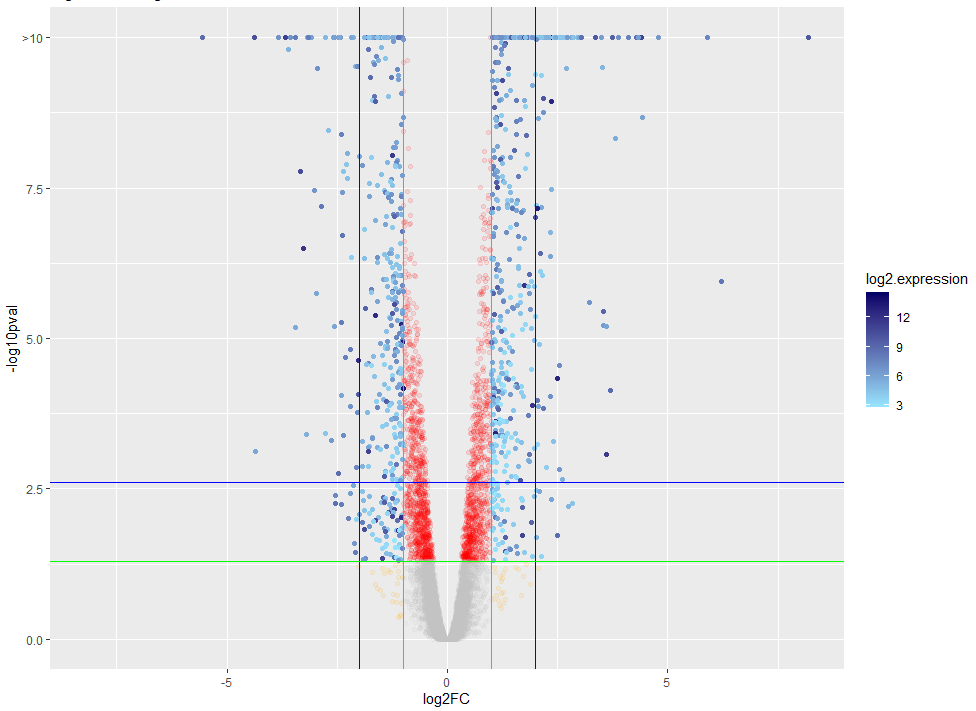
A volcano plot of a differential gene expression analysis is shown below. DE genes (blue) are called based on their log-fold change and adjusted p-value of the comparison to the null hypothesis.
An enrichment analysis can be performed using g:profiler against the standard GO terms, and the KEGG and reactome pathway databases. The observed set should be the DE genes, the background set all genes that have passed the noise filter.
To increase the visibility of CSCI research in the wider community, we create shiny apps for each bulk mRNA-Seq dataset which can be used to explore data and share more detailed results along with publications. For standard bulk mRNA-Seq datasets, we recommend using bulkAnalyseR (Moutsopoulos, Williams, Mohorianu, 2021) to create these shiny apps.
