Alt Text:
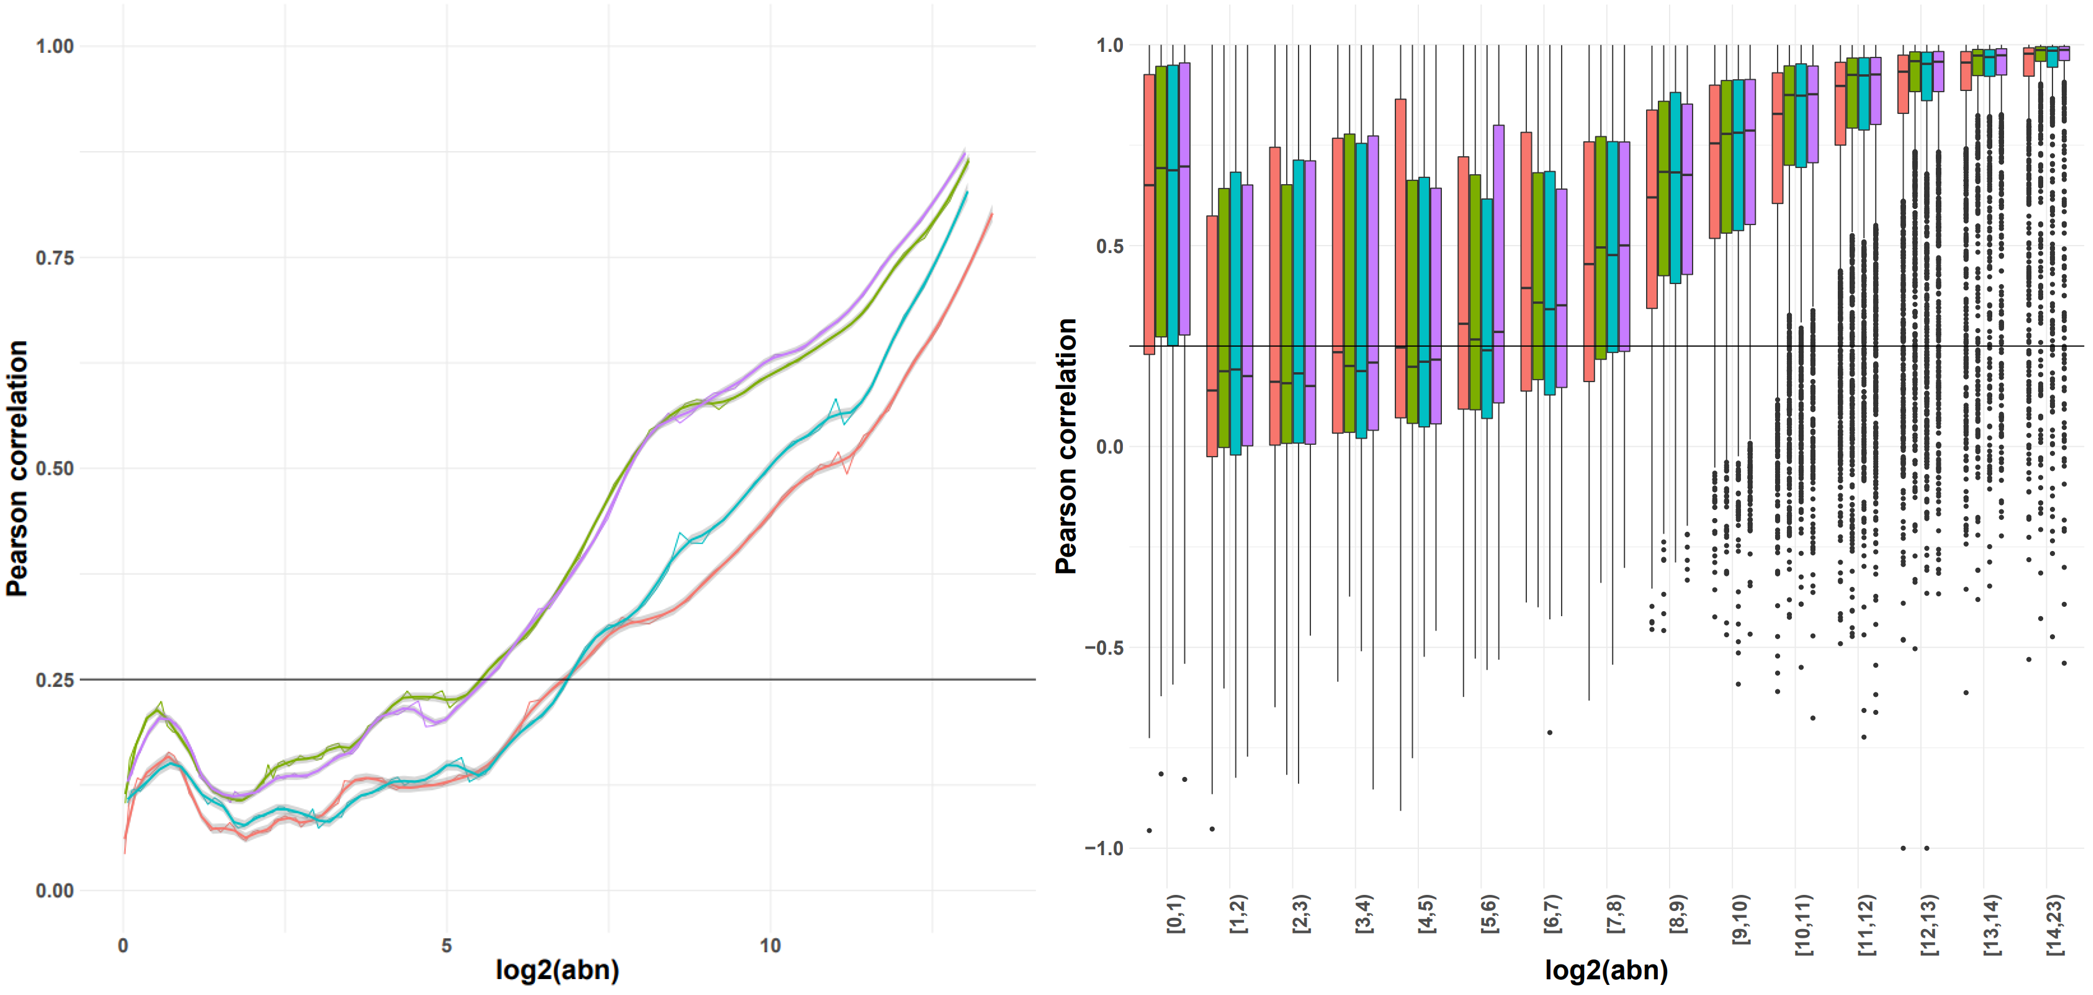
Indicative plots of the Pearson correlation calculated on windows of increasing average abundance for the count matrix-based noise removal approach (left) and per exon for the transcript-based noise removal approach (right).
Title Text:
Indicative plots of the Pearson correlation calculated on windows of increasing average abundance for the count matrix-based noise removal approach (left) and per exon for the transcript-based noise removal approach (right).


